Your Browsing History


Any questions? Our AI beta will help you find out quickly.
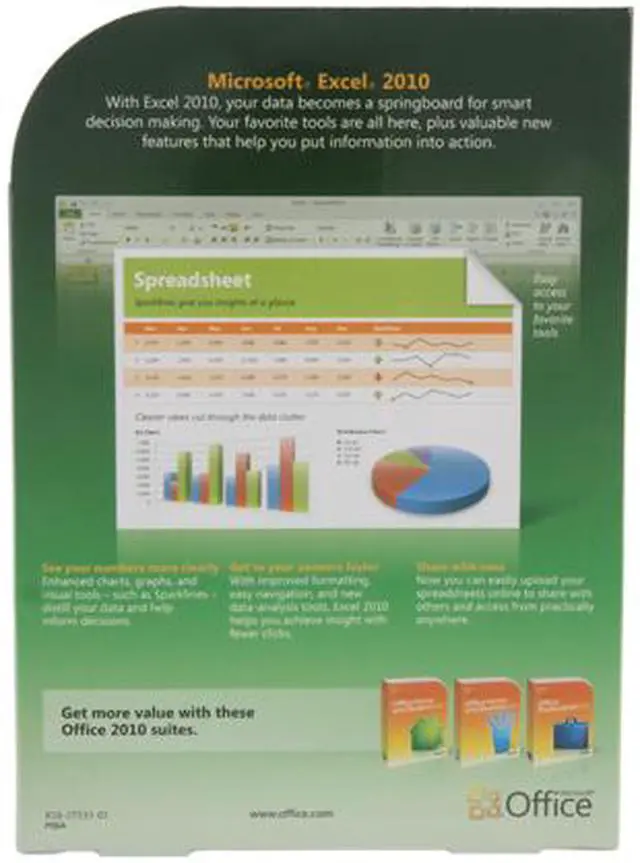
 Create Data Charts in a Single CellWith Sparklines, a new feature in Excel 2010, you can create small charts in a single cell to quickly discover patterns in your data. It’s a quick and easy way to highlight important data trends such as seasonal increases or decreases, saving you time.
 Zero in on the Right Data Points QuicklyExcel 2010 delivers new and exciting filter enhancements. The Slicer feature provides you with a rich visualization of your PivotTable and PivotChart views so you can dynamically segment and filter the data to display precisely what you need. With the new search filter, you can spend less time sifting through large data sets in your tables, PivotChart and PivotTable views, and more time analyzing.
 Efficiently Model and Analyze Almost Any DataThe PowerPivot for Excel 2010 add-in, a free download, provides groundbreaking technology such as streamlined integration of data from multiple sources and lightning-fast manipulation of large data sets with up to millions of rows. Business users can effortlessly publish and share analysis through Microsoft SharePoint Server 2010, and have other users enjoy the same Slicer, PivotTable, and fast-query capabilities when working on their Excel Services report.
 Access Your Spreadsheets from Virtually AnywherePost your spreadsheets online and then access, view, and edit wherever from just about any computer or your Windows phone. With Excel 2010, you can take advantage of a best-in-class spreadsheet experience across multiple locations and devices.
 Connect, Share, and Accomplish More when Working TogetherCo-authoring through the Microsoft Excel Web App makes it possible for you to edit the same spreadsheet with others simultaneously from different locations. You can see who’s working on a spreadsheet with you at the same time. See changes from others appear as they are made. And with the number of editors in the workbook shown on the status bar, you'll always know who else is editing the workbook with you.
 Add More Sophistication to Your Data PresentationsConditional Formatting in Excel 2010 gives you more control over styles and icons, improved data bars, and the ability to highlight specific items in a few clicks. You also can display data bars for negative values to more accurately illustrate your data visuals.