

Shipped by Newegg
Familiar functionality, added capability
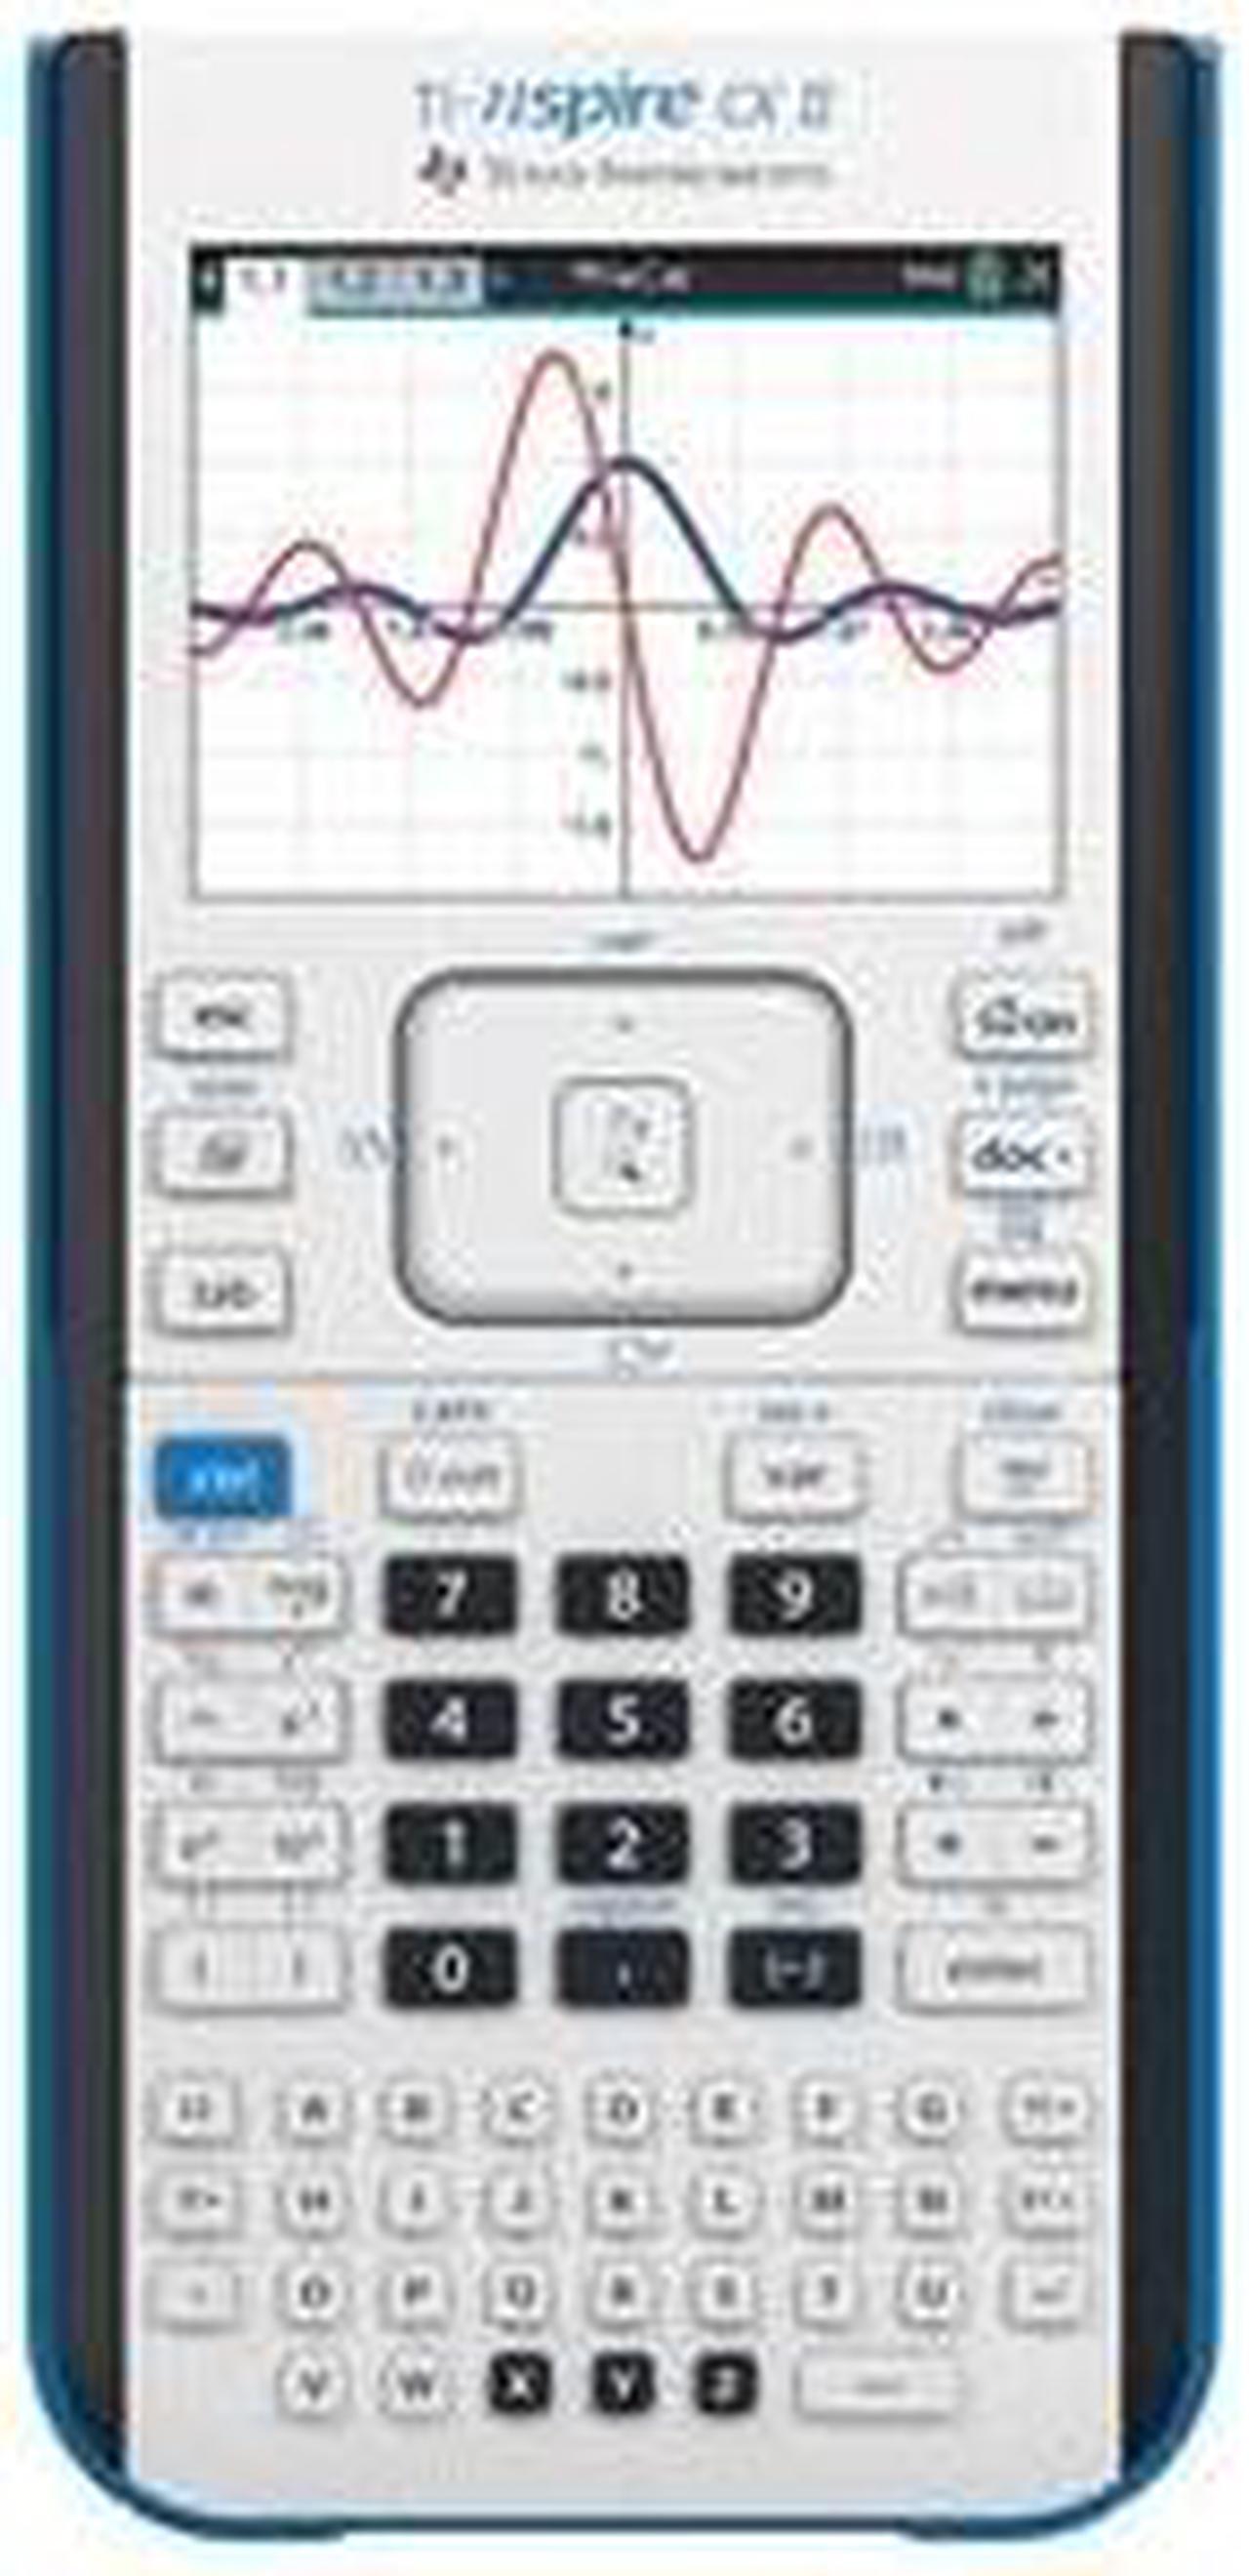
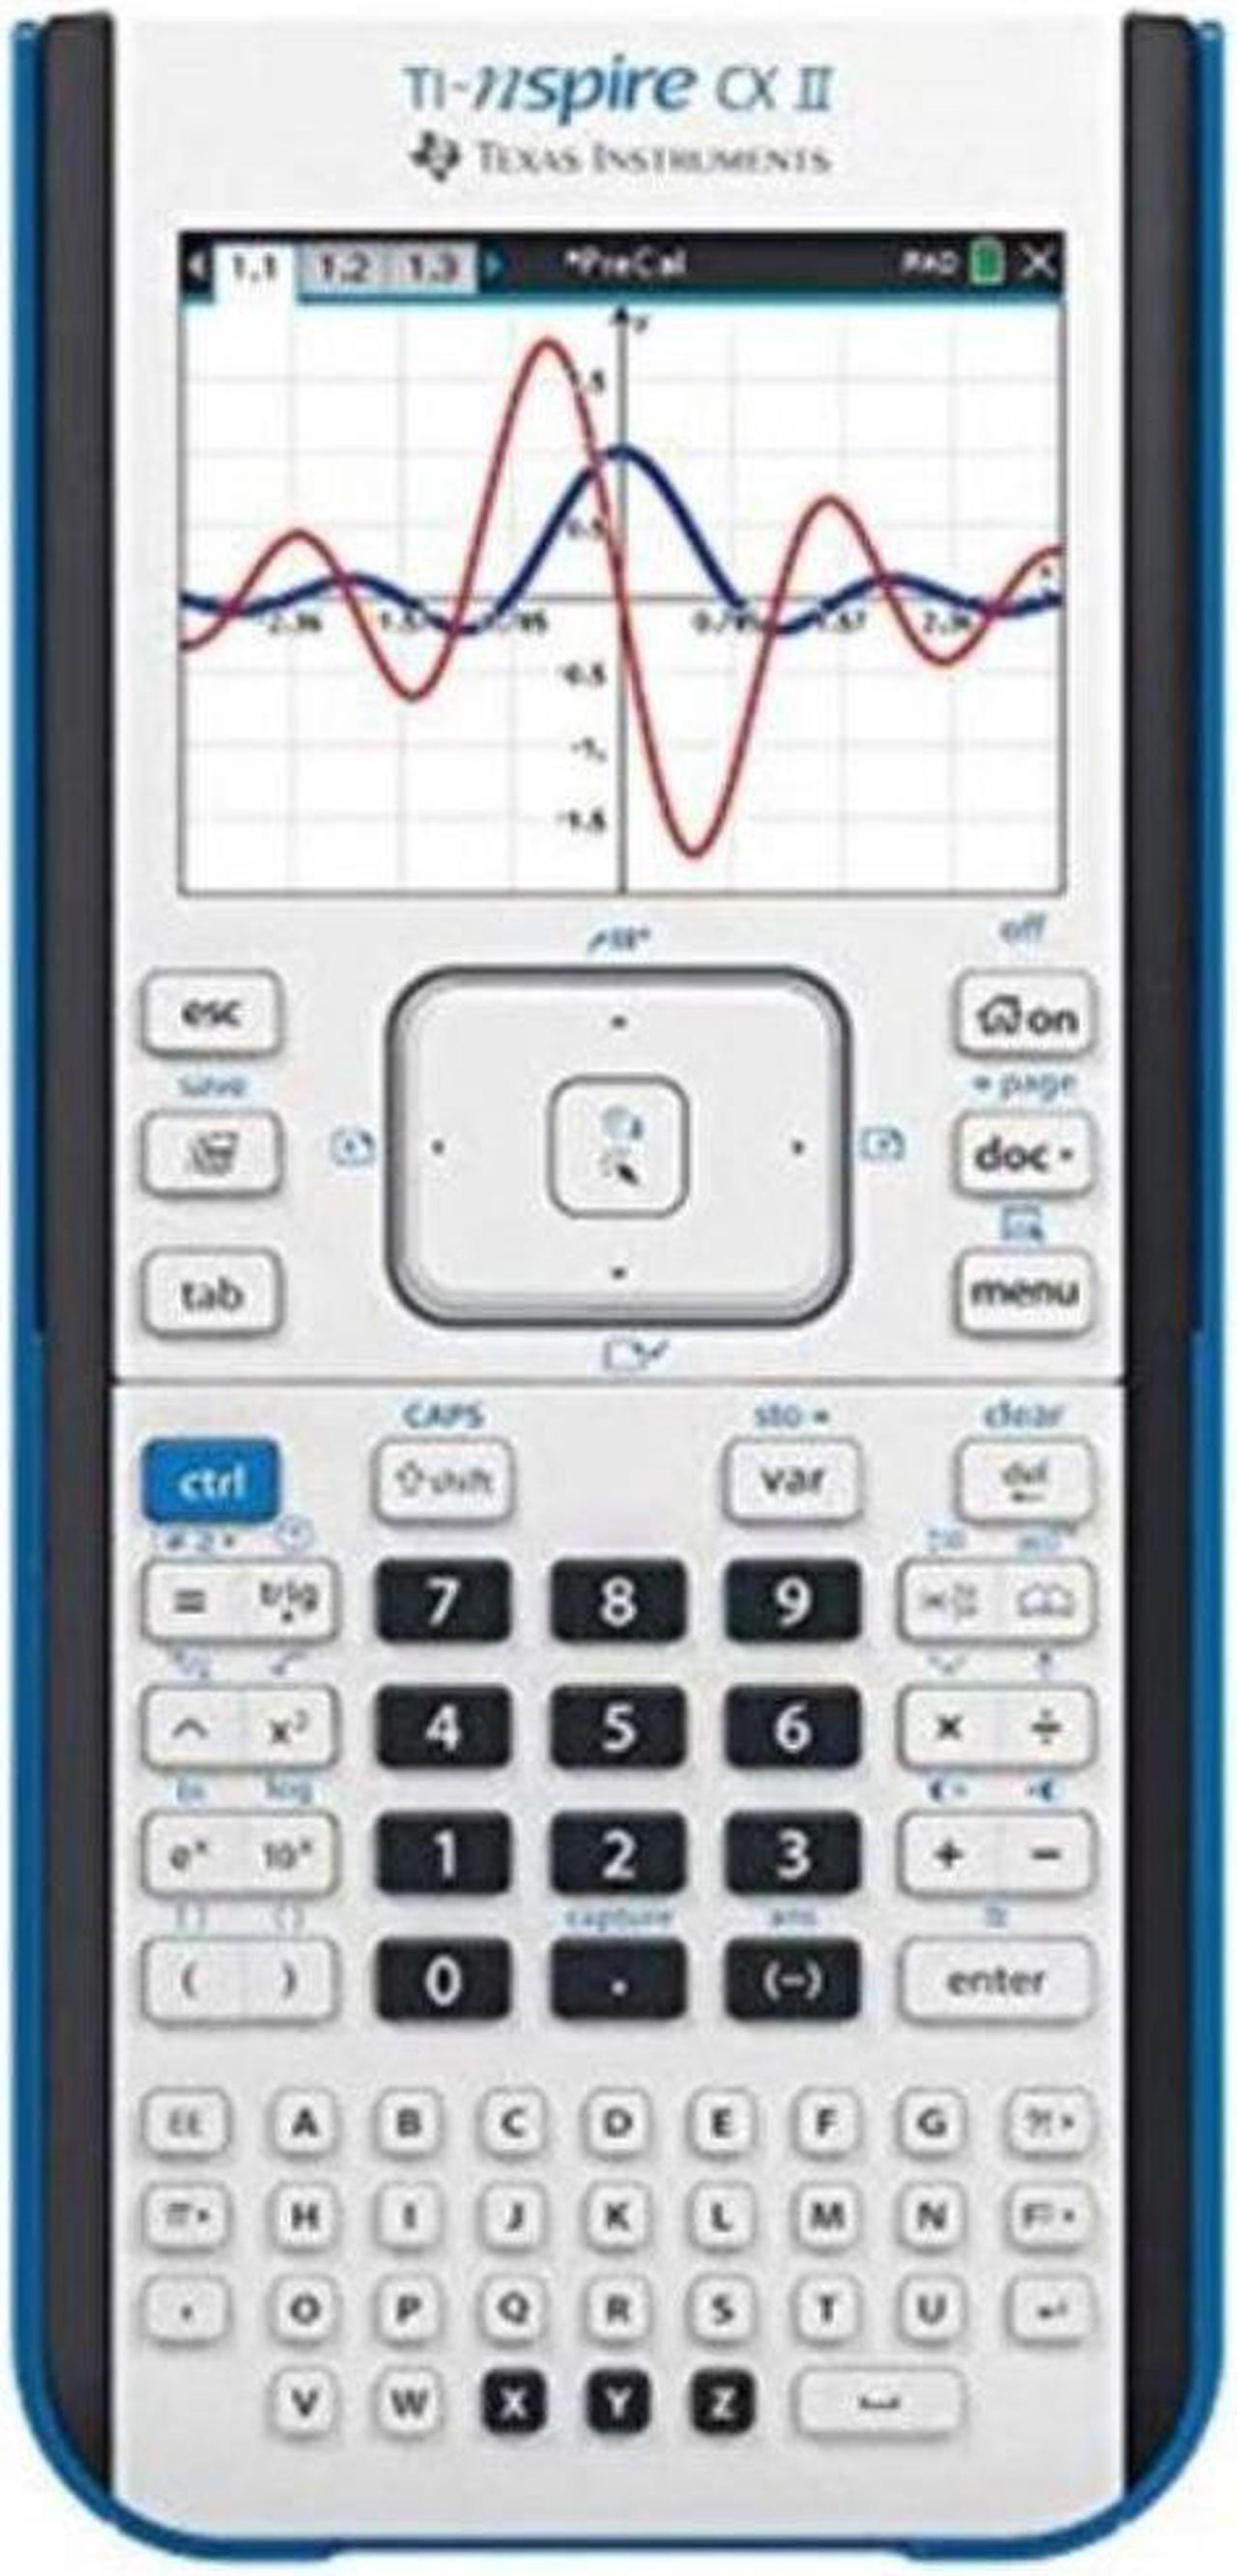
Faster performance, added interactive visuals and easier-to-read graphics expand the TI-Nspire™ CX graphing calculators classroom-proven ability to support inquiry and discovery.
New features open new paths to understanding
Create opportunities for hands-on engagement with added interactive features.
Animated path plot
Visualize function, parametric and polar graphs as they are drawn in real time.
Dynamic coefficient values
Explore direct connections between dynamic coefficients in equations and graphs.
Points by coordinates
Create dynamic points defined by coordinates, sliders or expressions quickly.
Tick-mark labels
Label axes scales to create visual contexts that promote understanding.
Python programming
Program easily with this coding language thats great for STEM classes and more.
Easier-to-read graphics
New app icons, supported by color-coded screen tabs, improve the user experience.
Built on a proven foundation
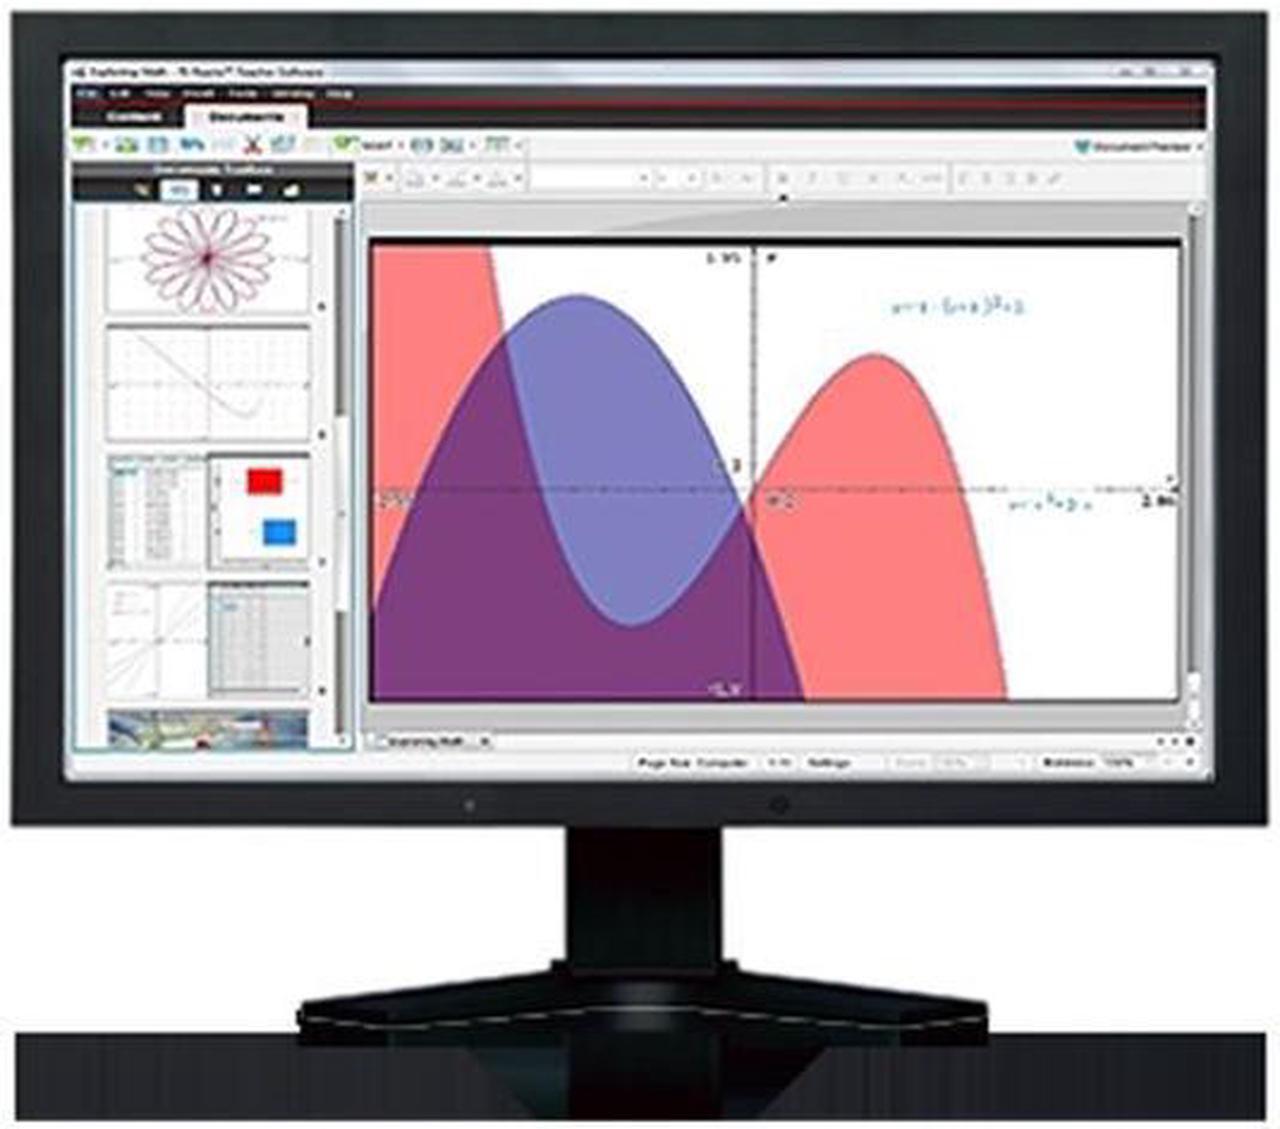
From the keyboard and computer-menu interface to the ability to save and share work with built-in apps, the TI-Nspire™ CX II models retain the features and functionality that make TI-Nspire™ CX graphing calculators ideal for math and science from middle grades through college.
Calculator
Perform computations and enter expressions, equations and formulas in proper math notation. Lists & Spreadsheet
Perform mathematical operations on data and visualize the connections between the data and their plots.
Graphs
Plot and explore functions, equations and inequalities, animate points on objects and graphs, use sliders to explain their behavior and more.
Data & Statistics
Summarize and analyze data using different graphical methods such as histograms, box plots, bar and pie charts and more.
Geometry
Construct and explore geometric figures and create animations.
Notes
Enter notes, steps, instructions and other comments on the screen alongside the math.
Vernier DataQuest™ Application
Create a hypothesis graphically and replay data collection experiments all in a single application.
Programming
Add new functionality and create rich STEM activities with Python and TI-Basic coding languages.