

Your Browsing History

Meet Your Seller


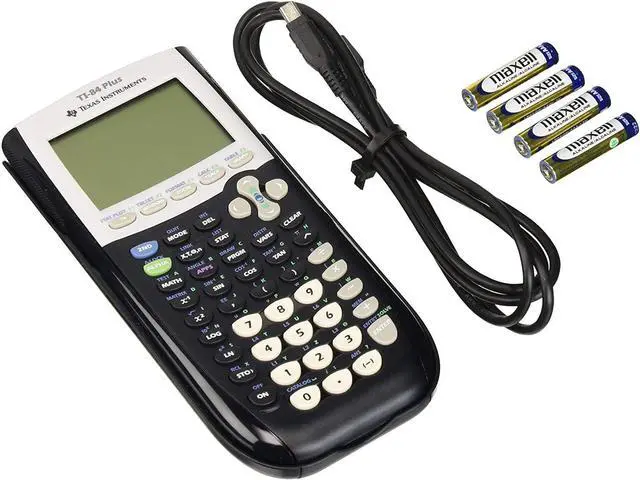
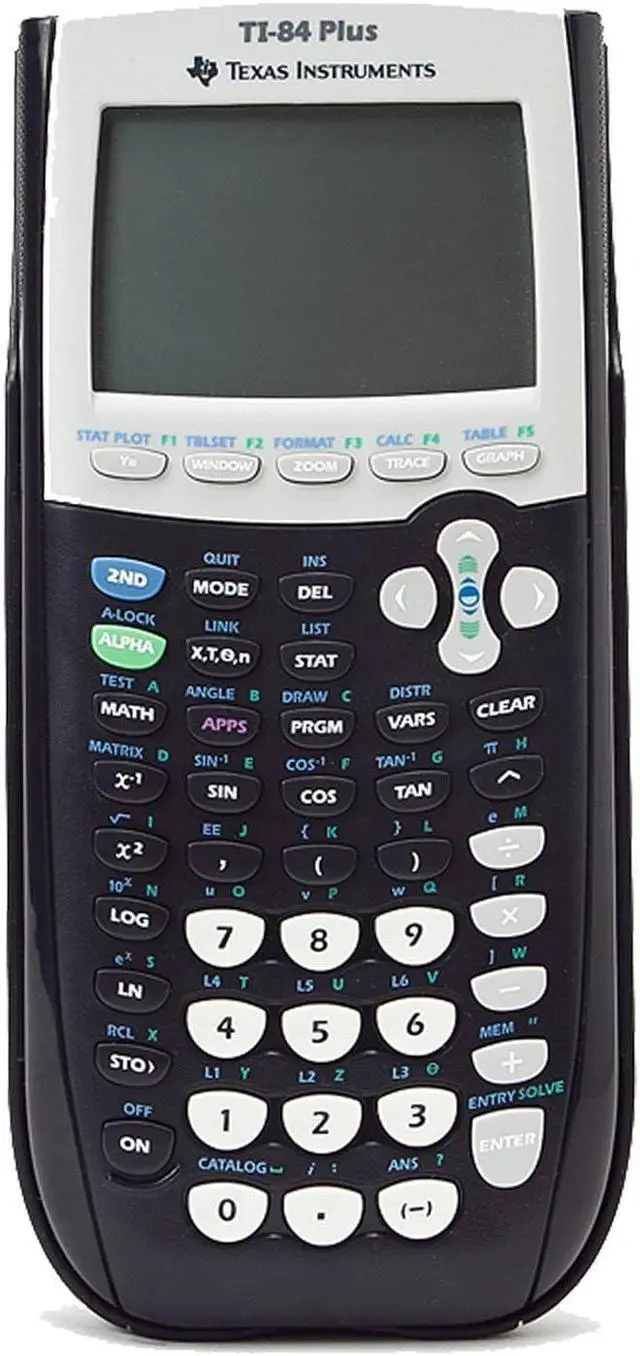
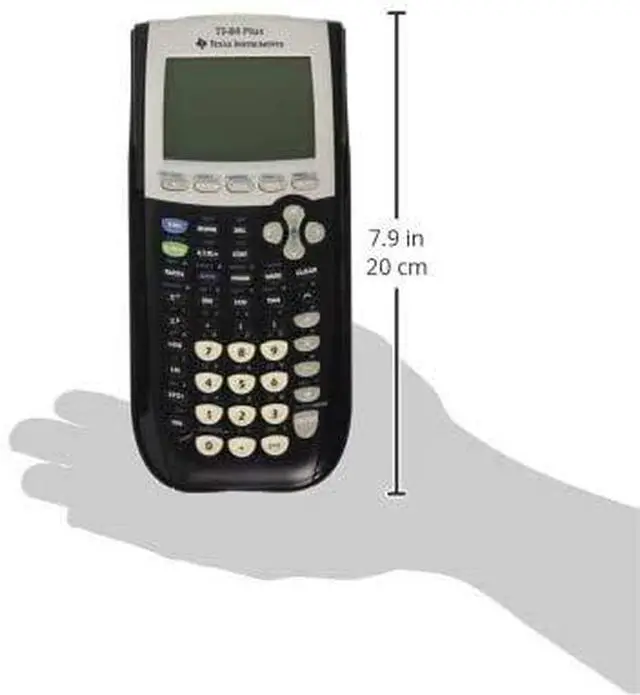
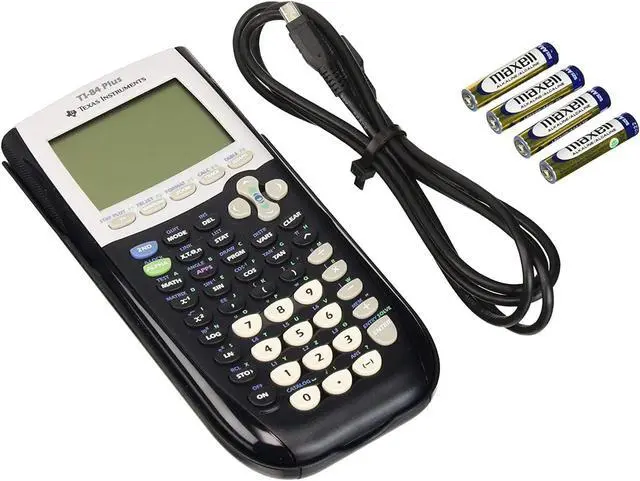
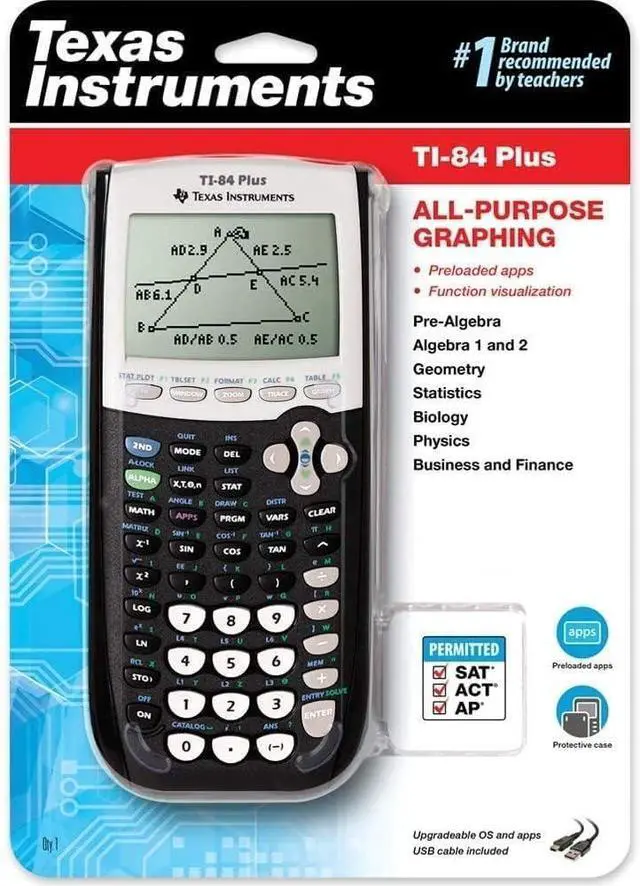
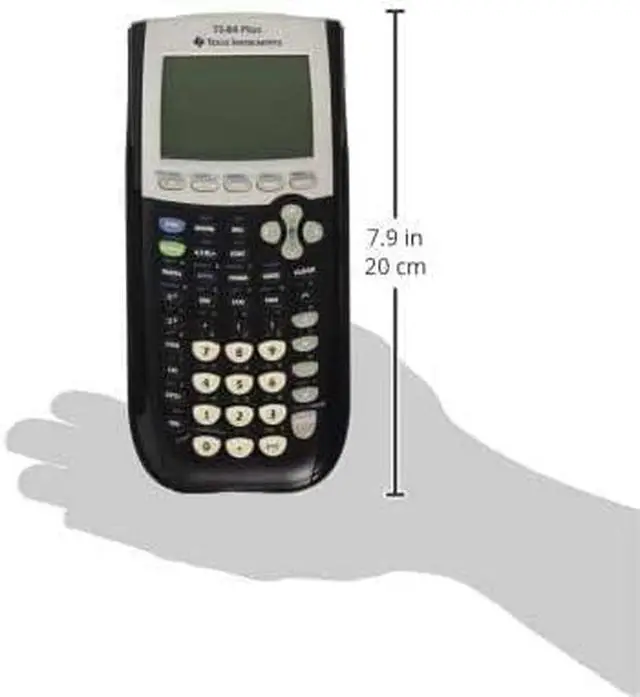


Ti-84 plus Graphing calculator - Black
- Real and complex numbers are computed to 14-digit precision and shown with 10 digits plus a 2-digit exponent. It graphs 10 rectangular functions, 6 parametric expressions, 6 polar expressions, and 3 recursively-defined sequences. As many as 10 graphing functions can be defined, saved, graphed, and analyzed simultaneously. Sequence graphing mode displays time series plots, cobweb/stair-step plots, and phase plots. It features user-defined list names. Lists can hold up to 999 elements. It contains 14 interactive zoom features. Numeric evaluations are provided in table format for every graphing mode. It enables interactive analysis of function values, roots, maximums, minimums, integrals, and derivatives. It offers 7 distinct graph styles to differentiate the appearance of each graph drawn. It provides horizontal and vertical split-screen options. It stores up to ten 50x50 matrices. It performs matrix operations including inverse, determinant, transpose, augment, reduced row echelon form, and elementary row operations. It converts matrices to lists and vice-versa. It conducts list-based one- and two-variable statistical analysis, including logistic, sinusoidal, median-median, linear, logarithmic, exponential, power, quadratic polynomial, cubic polynomial, and quartic polynomial regression models. It includes 3 statistical plot definitions for scatter plots, xy-line plots, histograms, regular and modified box-and-whisker plots, and normal probability plots. It features advanced s
+
+
Overview
Specs
Reviews

Any questions? Our AI mode will help you find out quickly.
Try me now
Real and complex numbers are computed to 14-digit precision and shown with 10 digits plus a 2-digit exponent. It graphs 10 rectangular functions, 6 parametric expressions, 6 polar expressions, and 3 recursively-defined sequences. As many as 10 graphing functions can be defined, saved, graphed, and analyzed simultaneously. Sequence graphing mode displays time series plots, cobweb/stair-step plots, and phase plots. It features user-defined list names. Lists can hold up to 999 elements. It contains 14 interactive zoom features. Numeric evaluations are provided in table format for every graphing mode. It enables interactive analysis of function values, roots, maximums, minimums, integrals, and derivatives. It offers 7 distinct graph styles to differentiate the appearance of each graph drawn. It provides horizontal and vertical split-screen options. It stores up to ten 50x50 matrices. It performs matrix operations including inverse, determinant, transpose, augment, reduced row echelon form, and elementary row operations. It converts matrices to lists and vice-versa. It conducts list-based one- and two-variable statistical analysis, including logistic, sinusoidal, median-median, linear, logarithmic, exponential, power, quadratic polynomial, cubic polynomial, and quartic polynomial regression models. It includes 3 statistical plot definitions for scatter plots, xy-line plots, histograms, regular and modified box-and-whisker plots, and normal probability plots. It features advanced statistics with 9 hypothesis testing functions, 6 confidence interval functions, and one-way analysis of variance. Features: Over 200 functions and a multi-line display
Warranty & Returns
Warranty, Returns, And Additional Information
Warranty
- Please contact the Seller directly for warranty information. Warranty information may also be found on the Manufacturer's website.
- CONTACT
Return Policies
- Return for refund within: 30 days
- Return for replacement within: 30 days
- This item is covered by EpicTransTrade Return Policy
Manufacturer Contact Info
- For a directory of all our manufacturers, please click below.
- Manufacturers Directory
LOADING...